Skip to content
Information process models

Models of information, case by case

Each topic here starts with a situation you would recognise — a form, a filing system, a message in transit — and shows what a model of it captures, what it quietly assumes, and where it stops being useful.

A hand-drawn flow diagram of boxes and arrows on a whiteboard
The lead article

Four ordinary situations, one way of describing them

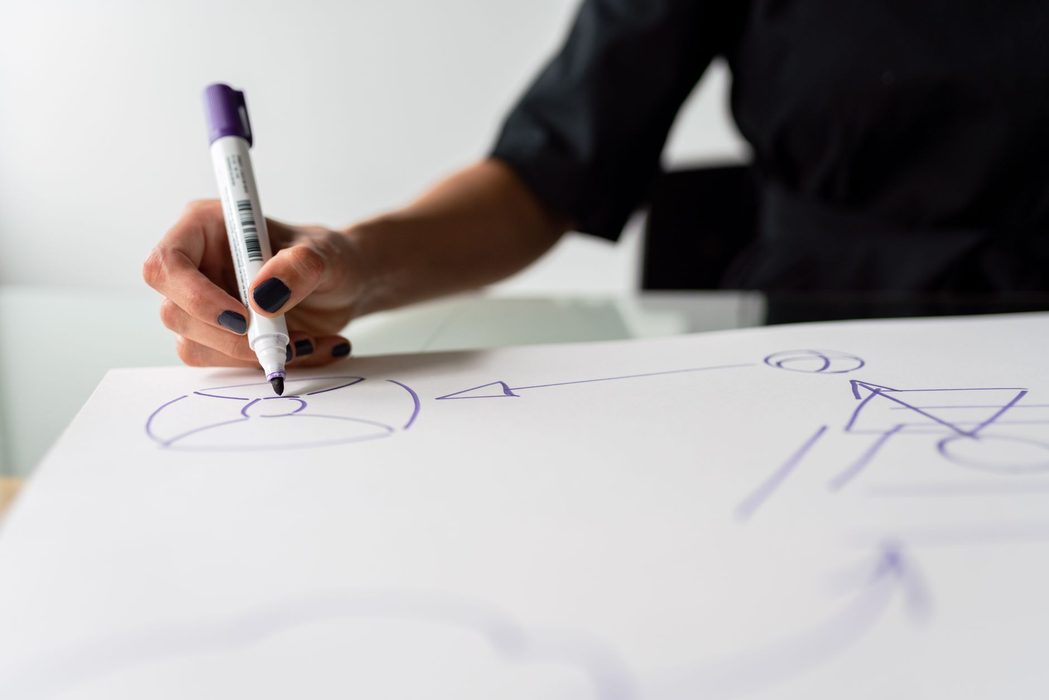
A person drawing a flow diagram of boxes and arrows on a whiteboard
A flow sketched on a whiteboard: boxes for steps, arrows for what moves between them.

The lead articleUpdated September 2026

A model is a description you can argue with

Picture a village hall booking sheet by the door. Someone writes a name, a date and a phone number; a volunteer copies it into a notebook each Friday; the notebook lives in a cupboard; and when a caller asks whether the hall is free on a Saturday in March, somebody walks to the cupboard and looks. That is an information process, and describing it in those terms is already a model: inputs, a step that changes their form, a place they rest, and a request that pulls them back out.

The value of writing it down is not tidiness. A described process can be questioned. You can ask what happens if two people write on the same line, or if the notebook is in the cupboard while the volunteer is on holiday. Nobody can ask those questions of a process that only exists as habit. A model turns an arrangement people merely follow into something they can inspect, compare with a different arrangement, and correct.

The same four moves keep reappearing

Across very different situations, the same handful of moves shows up. Information is collected — on a form, by a meter, in a phone call. It is processed — totalled, sorted, translated, checked against a rule. It is stored — on paper, in a spreadsheet, in a filing system that someone once designed and nobody has revisited. And it is transmitted — handed over, posted, read aloud, sent between two systems that must agree on what the fields mean.

A GP surgery taking a new patient's details, a courier scanning a parcel at a depot, a school recording attendance at nine o'clock: they differ in scale and in consequence, but a model of each will have those four kinds of step in it. That is why it is worth learning the vocabulary once rather than relearning it for every case. The situations vary; the grammar used to describe them does not vary much at all.

Inputs, outputs and the arrows in between

Most confusion in a described process sits on the arrows, not in the boxes. People can usually agree on the steps. What they disagree about is what exactly travels between them, in what form, and how often. Is the arrow a single figure or a whole record? Does it move the moment something happens, or once a week in a batch? Does the receiving step get everything, or only the fields it is entitled to see?

So it helps to name each arrow as carefully as each box. A meter reading is not the same thing as a bill; a completed form is not the same thing as a confirmed booking. When an arrow is labelled precisely, the relationships become visible: which step cannot begin until another finishes, which two steps could run at the same time, and where a single missing value stops everything further down the line.

Where the description stops matching the room

Every model quietly assumes things. The booking sheet model assumes one volunteer, one notebook, and a caller patient enough to wait while someone walks to the cupboard. It assumes handwriting is legible and that dates are written the same way each time — 3/4 meaning the third of April, not the fourth of March. None of those assumptions is written on the sheet. They only become visible when one of them fails.

That is the honest limit of the exercise, and it is worth stating plainly rather than treating a diagram as the truth. A model is a simplification chosen for a purpose; it leaves out whatever the purpose does not need. The skill is noticing when the thing left out has started to matter — when volumes grow, when a second site opens, when the person who remembered the exceptions retires. At that point the model has not been proved wrong. It has simply reached the edge of the situation it was drawn for.

Before you commit

Seven things to check before you trust a model

  • Name the situation the model was built for. A queue model drawn for a village post office at 9am on a Tuesday will behave differently when applied to a city sorting hub in December.
  • Follow one real record end to end. Take a single form, reading or message and trace where it enters, what changes it, where it rests and who eventually reads it. Gaps show up fast.
  • List the inputs the model expects and ask what arrives when one is missing. A postcode field left blank, a sensor offline for an hour, a date typed as 03/04 with no year agreed.
  • Separate what is measured from what is assumed. Many diagrams quietly treat an estimate, a rounded figure or a default setting as if it were an observed fact.
  • Check where information is stored and how long it stays there. A model that shows storage as one box hides questions about copies, backups, versions and deletion.
  • Look at every point where information moves between parties. Each handover is a place where meaning can shift: different labels, different units, different ideas of what counts as complete.
  • Ask what the model deliberately leaves out. Simplification is the point of modelling, but the omissions should be written down rather than discovered later by accident.
  • Decide in advance what evidence would tell you the model no longer fits, and who is expected to notice it. Models rarely fail loudly; they drift.
Common questions

Questions readers ask us

What exactly is an information process model?

It is a deliberate simplification of how information is gathered, changed, kept and passed on in a particular situation. It names the inputs, the steps, the outputs and the relationships between them. A library loan, a GP appointment booking and a weather station reading can all be described this way. The model is not the situation itself; it is a working description that is useful precisely because it leaves things out.

Do I need a technical background to follow this material?

No. Every page here starts from an ordinary scene: a paper form on a counter, a text message that arrives twice, a spreadsheet emailed between two offices. The vocabulary of inputs, outputs, assumptions and limits is introduced through those cases rather than through notation. Where a formal term is standard, we say it plainly and then show what it looks like in practice.

Why do you organise everything around situations rather than theory?

Because a model only means something once you know what it was drawn for. Reading a definition of transmission tells you less than watching one referral letter travel between two practices and noticing what could go wrong at each handover. Cases also make limits visible: you can see the exact point where a tidy diagram stops describing what actually happened on the day.

How is a model different from the diagram on the wall?

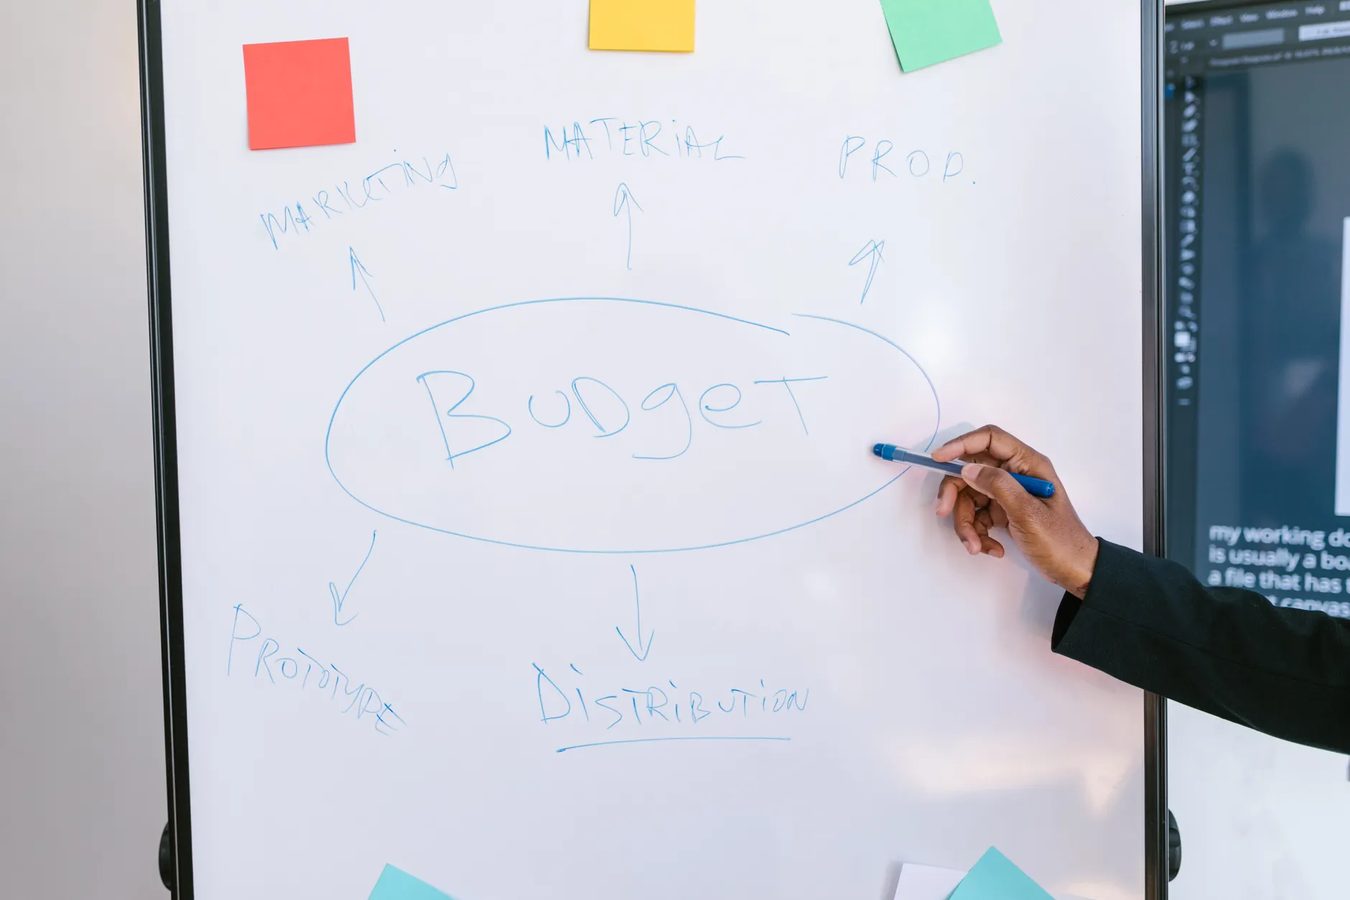
A diagram is one way of showing a model, and often a partial one. Behind the boxes and arrows sit choices about scope, timing, units, what counts as one record and what happens in unusual cases. Two teams can share an identical flowchart and still disagree about how the process works, because the assumptions were never written beside the picture.

When does a model stop being useful?

Usually when the situation quietly changes and the model does not. Volumes rise, a new input channel appears, a rounding rule is adjusted, a party starts using a term differently. The model keeps producing answers, which is what makes drift hard to spot. Careful observers watch the mismatch between what the model predicts and what they can see happening.

Does this site recommend particular tools or platforms?

No. Monochromer is an independent educational publication, so we describe concepts rather than products. You will not find comparisons of software, vendors or services here, and nothing on the site is for sale. The ideas are meant to be readable whether you work with paper files, a shared spreadsheet or a large system, because the underlying questions are the same.

Can I use these pages for teaching or study?

You are welcome to read, quote and discuss them; the terms of service set out the details. The material is written as a general introduction for a broad audience rather than as a syllabus for any particular qualification, so check it against your own course requirements. If something reads as unclear or inaccurate, we would rather hear about it than not.

How do I get in touch about something on the site?

Use the contact page, which lists our email address, telephone number and postal address. Questions about wording, corrections and requests for a plainer explanation of a section are all fair game. We cannot review your organisation's own processes or give advice on a specific case, because the site is informational and deliberately stays general.

Cases we walk through

What we cover, one situation at a time

The everyday model, unpacked

We start with a single ordinary scene — a bus timetable, a doctor's appointment reminder — and ask what a model of it would actually hold. Inputs, outputs, the arrows between them, and the parts the diagram quietly leaves out. By the end of the walkthrough you can tell why someone bothered to draw it, and what question the drawing was meant to answer.

Collecting information

A paper form at a village hall, a card reader at a station barrier, a temperature sensor in a greenhouse. Each case gathers information differently, and each one decides in advance what counts as a valid entry. We look at how models describe those inputs, where the boundary of the collection sits, and what happens to anything that falls outside it.

Processing and transformation

Raw readings rarely mean much on their own. Meter numbers become a monthly bill; a stack of survey answers becomes a set of percentages. We follow typical transformation cases step by step, showing how a model names each operation, what it treats as a black box, and how rounding, grouping and sorting quietly change the answer.

Storage and retrieval

Keeping something is only half the situation; finding it again is the other half. We work through cases like a school archive, a shared drive and a shop's stock list, looking at what a model records about where information sits, how long it stays, which copy is treated as authoritative, and what a search does when the item is simply not there.

Transmission between parties

Information moves: a text message, a posted letter, a file handed between two departments. Models of transmission track what left, what arrived, what was confirmed and what the sender assumed the receiver already knew. We use plain cases to show where delays, duplicates and silent failures appear in the diagram — and where they do not.

Assumptions and limits

Every model rests on things nobody wrote down: that the clock is right, that names are unique, that the form was filled in honestly. We collect the assumptions that recur across cases, then look at the moment a model stops matching reality — and at how careful observers notice the mismatch instead of arguing with it.

How we read a case

Four steps we take through every situation

01 — Describe the situation before the diagram

We write down what is happening in plain words first: who is involved, what they want to know, what physically moves. No boxes, no arrows. This keeps the model answerable to the situation rather than the other way round, and it makes it obvious later when a neat diagram has quietly replaced a messy reality it could not hold.

02 — Name the inputs and the outputs

Next we list what goes in and what comes out, in the units the real case uses — a date, a meter reading, a yes or no. Naming them separately exposes the gaps: outputs nobody consumes, inputs nobody supplies, and fields that exist only because a previous version of the process needed them.

03 — Draw the relationships, then test them

Only then do we connect things: what depends on what, in which order, and what happens if a step is skipped or repeated. Each link gets a question attached to it. If we cannot say what the arrow would mean on a Tuesday afternoon in a real office, the arrow is doing decoration rather than work.

04 — Write down what the model does not cover

Finally we state the boundary out loud: the assumptions made, the cases deliberately excluded, the conditions under which the model would mislead. A limitation written down is a tool; the same limitation left unsaid is a trap. This step is why our case studies end with caveats rather than conclusions.

About this publication

An independent guide written case by case

Monochromer is an independent educational publication about the fundamentals of modeling information processes. We explain how models stand in for the collection, processing, storage and transmission of information — and we do it through situations rather than definitions. A reader who wants to understand why a diagram has three boxes and one dotted line gets more from following a household water meter reading to a bill than from a paragraph of theory. So that is how the material is built: an ordinary case, opened up slowly, with the terminology introduced where it earns its place.

A person sketching a simple boxes-and-arrows diagram on paper beside a notebook

Start with a situation you already recognise

Pick any case that looks familiar — a form, a meter, a message between two offices — and follow it through. The vocabulary of modeling is easier to hold once it is attached to something you have seen happen.